Introduction
One of the most time-consuming parts of application development is debugging. This already hard part of our day to day life can easily become a nightmare if the application crashes only on production and you cannot reproduce it on your local machine. Fortunately, we have .NET tools which can come really handy in these scenarios.
The Problem
To demonstrate what I am talking about imagine that we have an API that serves weather data. Yes, the default one from .NET Web Api creation.
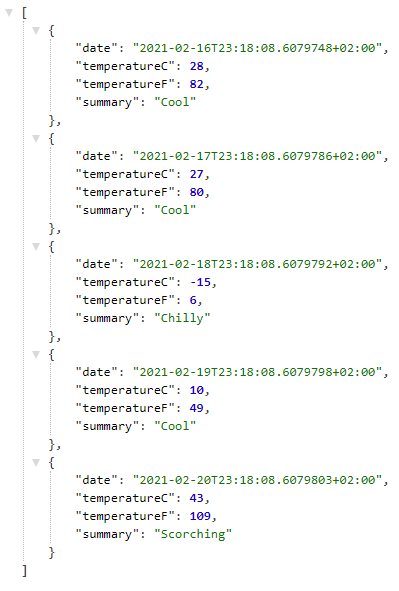
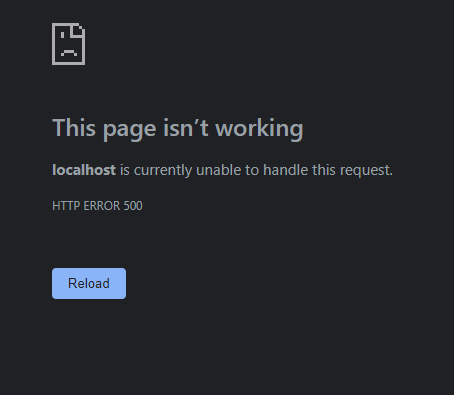
This application crashes after a week or two on production machine and you cannot figure out why.
Dotnet Tools
In case you are living under a rock .NET team released so called .NET Tools. A .NET tool is a special NuGet package that you can install and use as a normal CLI application. If you install it as a global tool, it automatically gets added to your PATH variable and you can use it everywhere in your PC. How cool is that?
Find the Problem in Our Application
We will use some .NET tools to figure out why our application behaves the way it does. This approach can be used even if you do not have the source code of the application. But having it certainly helps.
1. Install dotnet-counters Tool
dotnet-counters is a performance monitoring tool. It can display performance counter values that are published via the EventCounter API. For example, you can quickly monitor things like CPU usage.
However, we will only use it to identify our process. If you know your process Id you can skip this step.
Open your cmd and run:
dotnet tool install --global dotnet-counters
This is how you can install .NET tools. Pay attention to the global flag. This is what tells .NET that this is a global tool.
You can run:
dotnet-counters ps
Which will output every .NET application that is currently running on the machine. In my case there is only one.

As we clearly see the PID of our crashing application is 3552.
2. Create a Memory Dump
Once we identify the application that we want to debug we can create a memory dump. A memory dump takes all information from the RAM which is associated with our application and writes it to a file so we can analyze later.
Before taking a memory dump we need to install another tool:
dotnet tool install --global dotnet-dump
The dotnet-dump is a way to collect and analyze Windows and Linux dumps without any native debugger involved like lldb on Linux.
After installing the tool, we can start it:
dotnet-dump collect -p 3552
After it finishes writing a file is generated and dotnet-dump outputs its location.
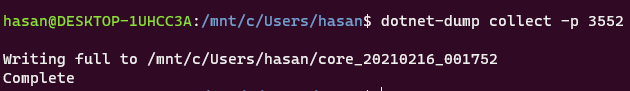
In my case the location is /mnt/c/Users/hasan/core_20210216_001752
The weird location is because I am using WSL2. If you want more information you can check Windows Subsystem for Linux .
3. Analyze the memory dump
With dotnet-dump except creating the dump we can also analyze it:
dotnet-dump analyze /mnt/c/Users/hasan/core_20210216_001752
The latest part of the command after analyze is the path to the dump file from previous step. This should give us a nice pointy arrow where we can execute some commands.

This tool is actually SOS.dll debugging extension from windbg which is integrated as .NET tool. You can execute the same commands which you can execute from the actual windbg with SOS installed.
Here is the documentation of SOS.dll .
Basically, SOS lets you view information about code that is running inside the .NET Core runtime. So, what we can do with this? We can print the entire heap and check what is in there:
dumpheap
This command can take quite some time if your heap is large. Unfortunately printing the entire heap is not useful. We only need the exceptions. Fortunately, we can apply a filter which prints only the exception objects that are in the heap:
dumpheap -type "Exception"
This will result in a lot less objects from the first one. From now on we can do some detective work. We know that our application throws this error occasionally which means that we can ignore all exceptions that have Count of 1.
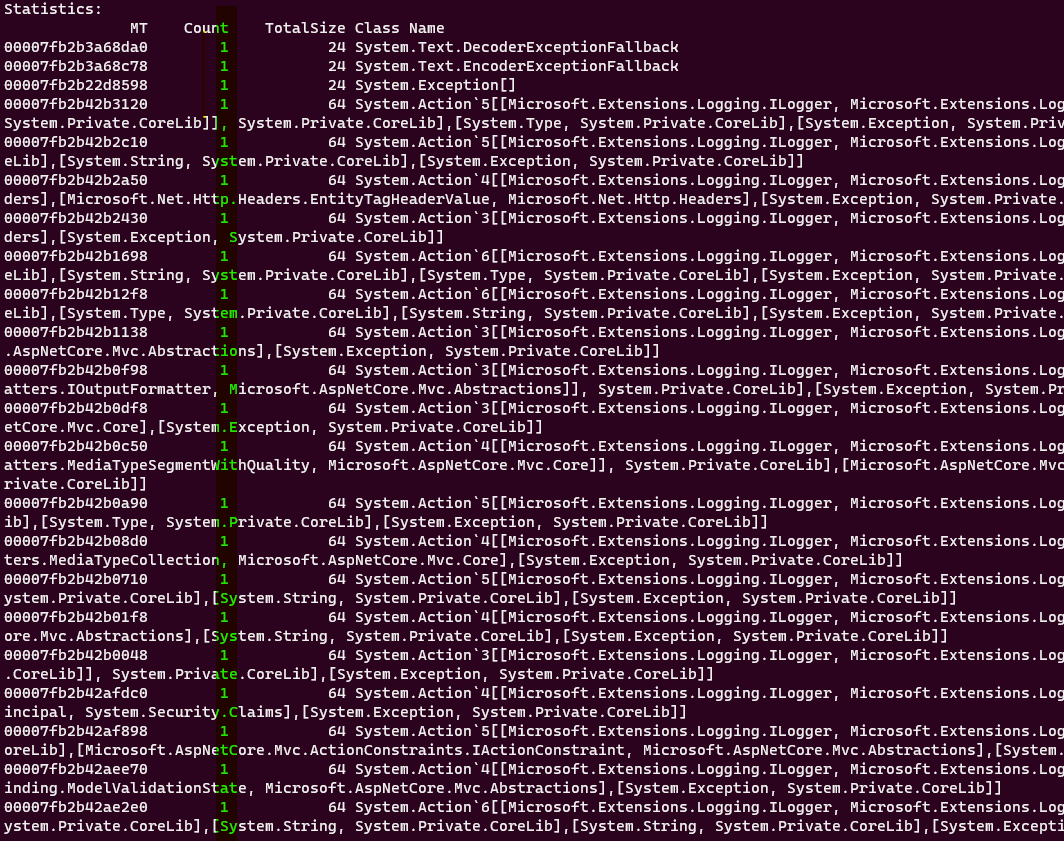
And focus only on these exceptions that have count of 2 or greater.
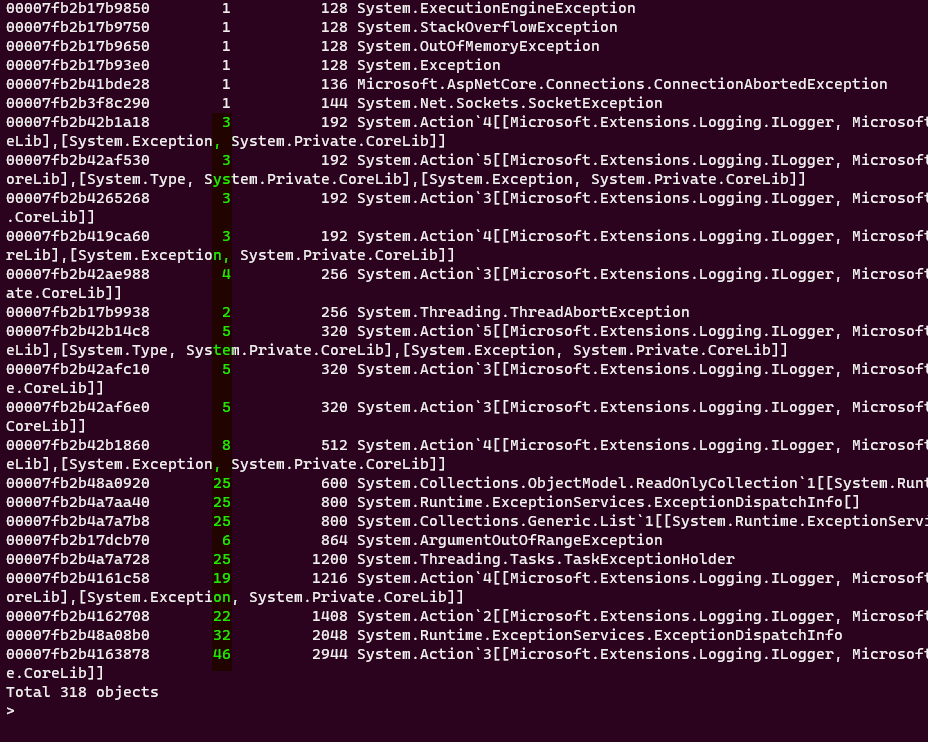
We can check each of these objects individually since they are not that many or we can continue our detective work. From now on everything boils down to experience. Which of these exceptions look like caused from a client application? Can you guess? If I already did not know the answer, I would start my investigation from System.ArgumentOutOfRangeException. Which is thrown 6 times. Other types look like internal .NET types.
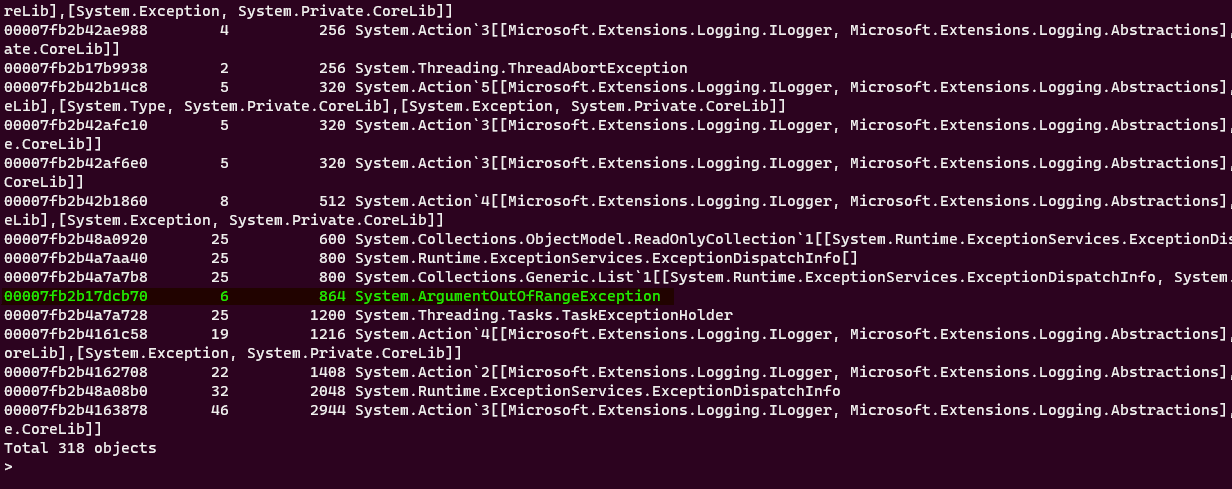
Let’s see all the 6 objects that are in the heap and have this type:
dumpheap -mt 00007fb2b17dcb70
With -mt (short from Method Table) we can display all objects that are associated with this method table. Which shows us every object that is of type System.ArgumentOutOfRangeException.
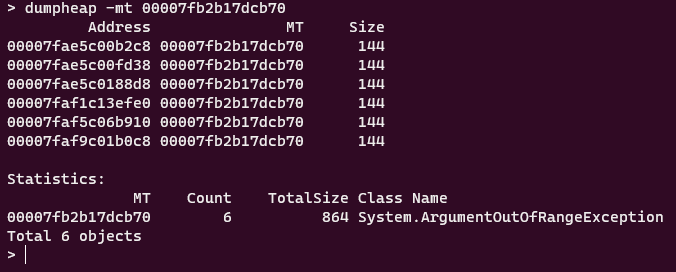
Each object has the same size. Which we can deduce that they are the same and it does not matter which one we pick. Let’s just pick the first one and see what is inside:
dumpobj 00007fae5c00b2c8
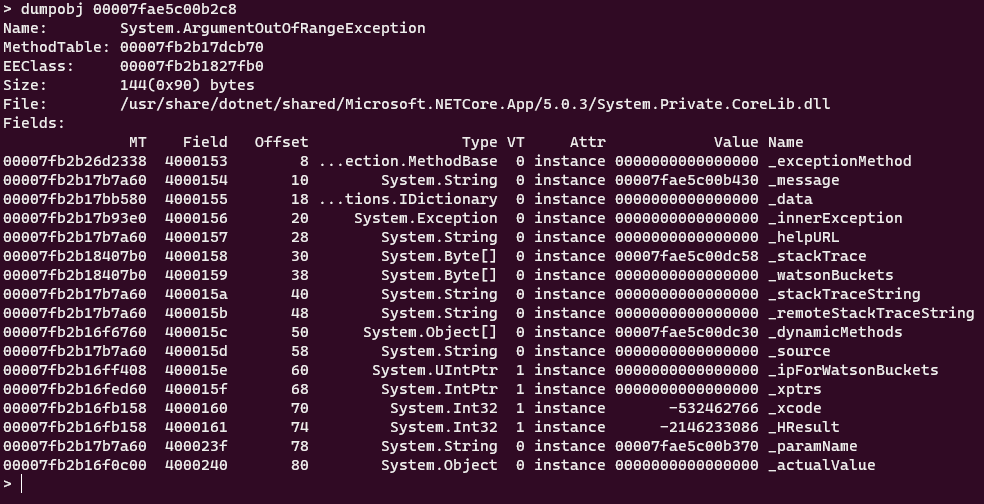
This should look familiar. These are the properties of System.ArgumentOutOfRangeException type. We can drill down further of each property to see what is inside but since this is an Exception type, SOS has a nice command to print the relevant information of the exception:
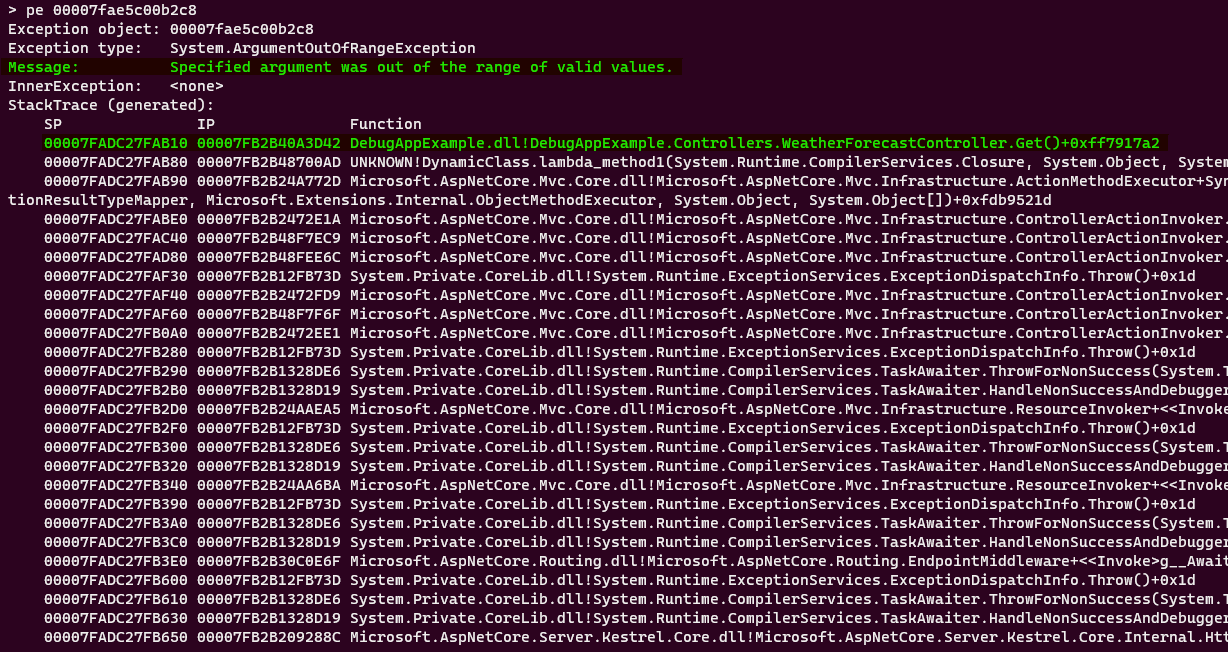
Here we can see the exception message and the stack trace on where our exception happened. Which clearly says that the exception is thrown on DebugAppExample -> Controllers -> WeatherForecasetController -> Get Method. Let’s check the code:
[HttpGet]
public IEnumerable<WeatherForecast> Get()
{
    var rng = new Random();

    if (rng.Next(0, 100) % 5 == 0)
    {
        throw new ArgumentOutOfRangeException("Specified argument was out of range of valid values");
    }

    return Enumerable.Range(1, 5).Select(index => new WeatherForecast
    {
        Date = DateTime.Now.AddDays(index),
        TemperatureC = rng.Next(-20, 55),
        Summary = Summaries[rng.Next(Summaries.Length)]
    })
    .ToArray();
}
We now know which method to look for the error and the exception message. From now on it is straight forward.
Conclusion
We take a look at .NET tools and used some of them to debug our live application. With the integration of SOS.dll we can analyze memory dumps both in Linux and Windows.
You can check the full source code of the demo application in my github .
What are your ways of debugging live applications whose behavior you cannot recreate locally? Share with me in comments or send a tweet.
Thank you
Your post has been submitted and will be published after moderation.
OK
OOPS!
Your post has not been submitted. Please return to the page and try again. Thank You!
If this error persists, please open an issue by clicking here.
OK